Case Study: Interactive Map + Data Visualization + Storytelling
Southern Poverty Law Center’s Hate Map
Transforming data into a powerful visualization to tell an alarming story of the challenges the country faces.

This interactive map is an immersive, user-centered experience that leverages data to tell a powerful story of where hate lives and how it shows up. The end product is a compelling, accessible experience that drives users toward deeper engagement.
Challenge
Translating years of data into an emotional, visually engaging experience that not only reflects the weight of what the data represents, but creates pathways to local and timely content to contextualize the visualization. This needed to happen all while building an accessible, mobile-first approach, prioritizing a user experience for everyone.
Impact
+62% Increase unique site visitors
+73% Visitors returning weekly or more
+71% Increased visits from main site
Role
Research
User Experience Design Lead
Visual Design Design
Interaction Design
QA
ThinkShout Team
2 Strategists
5+ Developers
1 Producer
1 Designer
Key Features
Heat map based on hate per capita
Timeline slider
Layered filtering based on ideology and state
Related News for each ideology and state
Modals for individual chapters
State Detail Pages
Prioritized accessibility and mobile experience

Research + Discovery
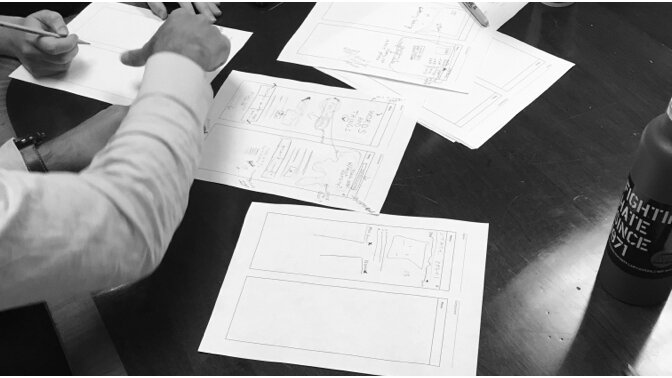
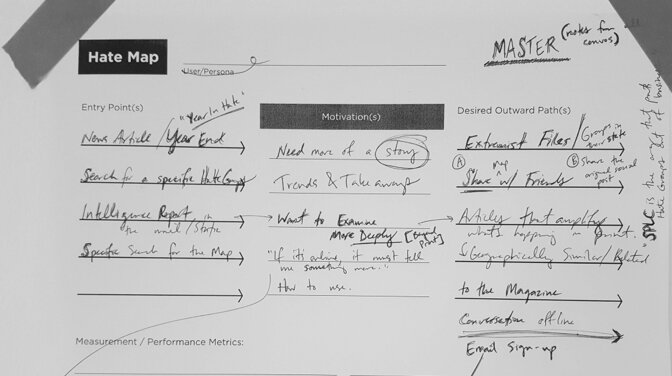
Immersing teams in collaborative discovery
Beginning with in-depth research and analysis of site analytics, our team came prepared to run a 2-day intensive on-site workshop alongside stakeholders from across the SPLC. Together we surfaced the unique story this map could tell, and the impact it could have with a successful outcome. We packed in fruitful exercises surfacing requirements and goals, got in-depth on audiences making empathy maps, and had fun sketching rapid wireframes.
Process
Onsite workshop
Analytics
Surveys
Landscape Analysis
Data flows
User Flows


Strategic
Recommendations
Design a mobile-first, 100% accessible experience to speak to all audiences
Create options for seeking out connected information based on user selections
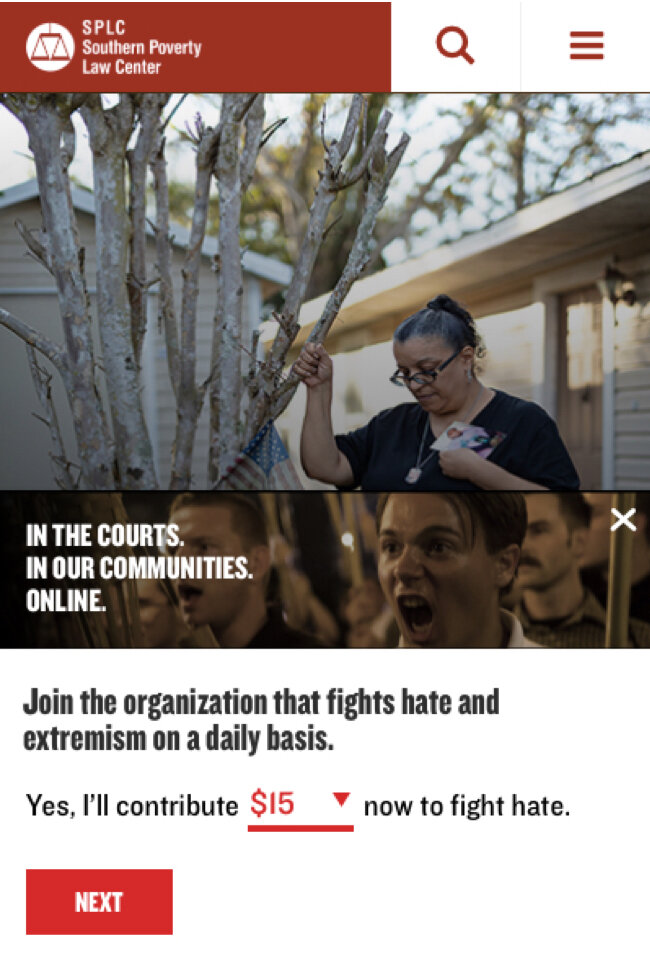
Leverage the well-known SPLC brand to reflect the nature of the content
Minimize the visual cues to let to create a focused experience
Aggregate data into state landing pages for a more focused user experience
Design the map visual to represent the population for a more accurate reflection of the data
User Experience: Interactive Map
Offering a User Experience that is Personal
Designing a user-centered experience for this emotionally-charged data visualization means allowing users to have more control. The design allows users to drive the experience through filtering by type of hate or location, while offering pathways toward deeper information and timely news. Connections to the range of content are all available but only surfaced as a user interacts with the map, giving users a clean experience they feel in control of.
Features
A simple and clean user experience that layers on controls as a user clicks
Aggregated timely content based on taxonomy structures like ideologies, hate groups, and location
Intuitive pathways leveraging interactions like trays and modals that guide users deeper without overwhelming the visualization

Visual Design: Data Visualization + Storytelling
Telling a powerful story through years of data
The visual design of this map transforms the user-centered experience into a powerful story. By removing the colorful iconography from the original map and focusing on just two of the SPLC brand colors, the design takes on the dramatic nature of the content it represents. Each design decision is carefully considered and tested to be accessible and purposeful. For example, the colors of the map represent the level of hate per capita in each state, allowing users to operate the timeline control to quickly see how the country has changed over the past 20 years.
Features
Data visualization based on hate group per capita
Long-form narrative to contextualize the SPLC’s work
Mobile-first and 100% accessible by screen readers and keyboard navigation
Dramatic visual queue’s that isolate iconography and imagery to user choices


A Focused Design Solution
As users dive deeper, they’ll discover state landing pages that aggregate all the data to allow them to focus on what personally resonates. These proved to be widely used by individuals and journalists as a tool to capture and share, telling a story that is especially relevant to their communities.


Usability Testing
Ensuring Connections through Engagement and A/B Testing
Following the successful launch of the map, our team helped the SPLC create ways to understand what speaks to users and how they are engaging. By designing several types of modals and calls-to-action, we could refine the experience to have the most impact.
Process
Develop an engagement plan
Design variable modals for desktop and mobile
Implement options and A/B Test